
Introduction
The choice of monitoring systems out there is overwhelming. When I recently needed to set up a monitoring system for a handful of servers, it became clear that many of the go-to solutions like Nagios, Sensu, New Relic would be either too heavy or too expensive – or both.
What I really needed was something lean I could spin up in a docker container and then ‘grow’ by extending the configuration or adding components as and when my needs change.
With those requirements in hand I soon came across Prometheus, a monitoring system and time series database, with its de-facto graphical front-end Grafana. I set it up for a trial run and it fit my needs perfectly.
While the set-up went fairly smoothly I did find some of the information on the web for similar set-ups slightly outdated and wanted to pull everything together in one place as a reference. This covers the as-of-writing current versions of Prometheus (0.18.0) and Grafana (3.0.1).
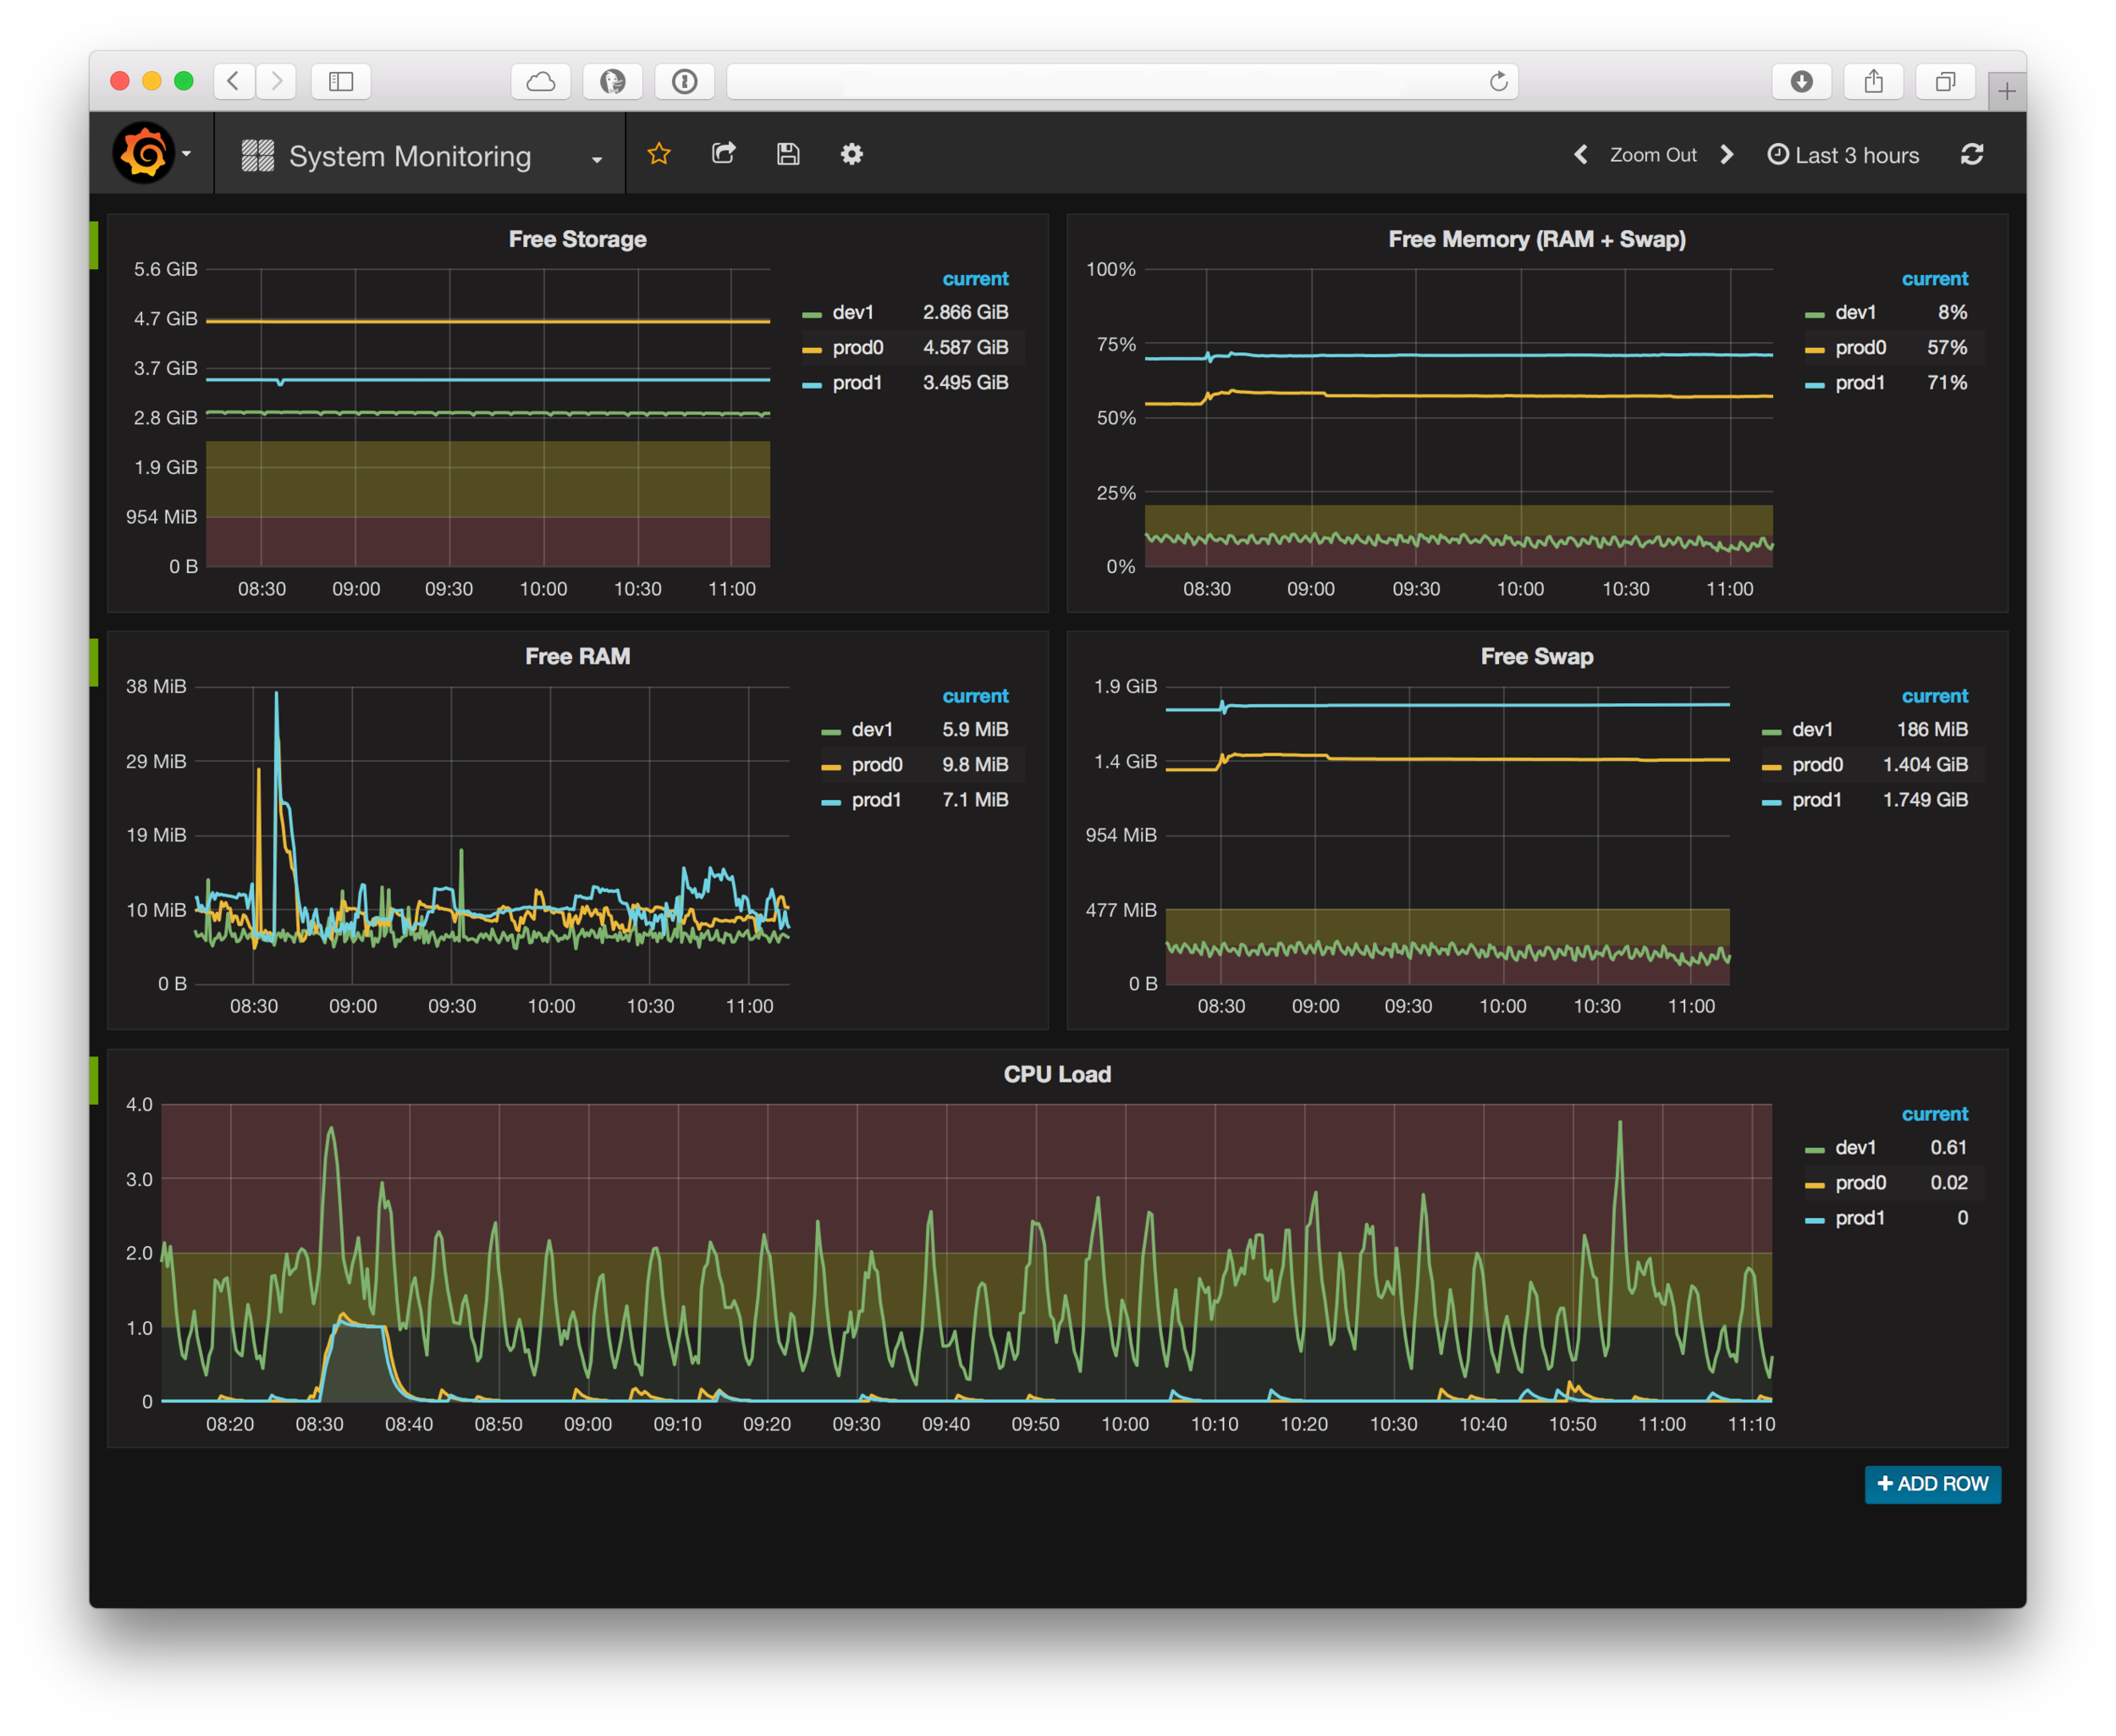
Because pictures are worth more than a thousand words, here’s what a Prometheus powered Grafana dashboard looks like:
Requirements
In order to follow along, you will need only two things
Follow the links for installation instructions. The versions used are docker 1.11 and docker-compose 1.7. Note that older versions will very likely work as well, but I have not tested it.
Components
Prometheus is a system originally developed by SoundCloud as part of a move towards a microservice architecture. As such, it consists of a few moving parts that are launched and configured separately.
While this may be a bit more complicated to set up and manage on the surface, thanks to docker-compose it is actually quite easy to bundle everything up as a single service again with only one service definition file and (in our example) three configuration files.
Before we dive in, here’s a brief run-down of the components and what they do:
- Prometheus - this is the central piece, it contains the time series database and the logic of scraping stats from exporters (see below) as well as alerts.
- Grafana is the ‘face’ of Prometheus. While Prometheus exposes some of its internals like settings and the stats it gathers via basic web front-ends, it delegates the heavy lifting of proper graphical displays and dashboards to Grafana.
- Alertmanager manages the routing of alerts which Prometheus raises to various different channels like email, pagers, slack - and so on. So while Prometheus collects stats and raises alerts it is completely agnostic of where these alerts should be displayed. This is where the
alertmanagerpicks up. - Exporters are http endpoints which expose ‘prometheus metrics’ for scraping by the Prometheus server. What this means is that this is a pull set-up. Note that it is also possible to set up a push-gateway which is essentially an intermediary push target which Prometheus can then scrape. This is useful for scenarios where pull is not appropriate or feasible (for example short lived processes).
Getting started
Launching Prometheus
We’ll start off by launching Prometheus via a very simple docker-compose.yml configuration file
# docker-compose.yml
version: '2'
services:
prometheus:
    image: prom/prometheus:0.18.0
    volumes:
        - ./prometheus.yml:/etc/prometheus/prometheus.yml
    command:
        - '-config.file=/etc/prometheus/prometheus.yml'
    ports:
        - '9090:9090'
and a prometheus configuration file prometheus.yml:
# prometheus.yml
global:
    scrape_interval: 5s
    external_labels:
        monitor: 'my-monitor'
scrape_configs:
    - job_name: 'prometheus'
      target_groups:
          - targets: ['localhost:9090']
As you can see, inside docker-compose.yml we map the prometheus config file into the container as a volume and add a -config.file parameter to the command pointing to this file.
To launch prometheus, run the command
docker-compose upVisit http://localhost:9090/status to confirm the server is running and the configuration is the one we provided.

Targets
Further down below the ‘Configuration’ on the status page you will find a section ‘Targets’ which lists a ‘prometheus’ endpoint. This corresponds to the scrape_configs setting by the same job_name and is a source of metrics provided by Prometheus. In other words, the Prometheus server comes with a metrics endpoint - or exporter, as we called it above - which reports stats for the Prometheus server itself.
The raw metrics can be inspected by visiting http://localhost:9090/metrics.
Adding a node-exporter target
While it’s certainly a good idea to monitor the monitoring service itself, this is just going to be an additional aspect of the set-up. The main point is to monitor other things by adding targets to the scrape_configs section in prometheus.yml . As described above, these targets need to export metric in the prometheus format.
One such exporter is node-exporter, another piece of the puzzle provided as part of Prometheus. What it does is collect system metrics like cpu/memory/storage usage and then it exports it for Prometheus to scrape. The beauty of this is that it can be run as a docker container while also reporting stats for the host system. It is therefore very easy to instrument any system that can run docker containers.
We will add a configuration setting to our existing docker-compose.yml to bring up node-exporter alongside prometheus . However, this is mainly for convenience in this example as in a normal setup where one prometheus instance is monitoring many other machines these other exporters would likely be launched by other means.
Here’s what our new docker-compose.yml looks like:
# docker-compose.yml
version: '2'
services:
    prometheus:
        image: prom/prometheus:0.18.0
        volumes:
            - ./prometheus.yml:/etc/prometheus/prometheus.yml
        command:
            - '-config.file=/etc/prometheus/prometheus.yml'
        ports:
            - '9090:9090'
    node-exporter:
        image: prom/node-exporter:0.12.0rc1
        ports:
            - '9100:9100'
We simply added a node-exporter section. Configuring it as a target only requires a small extension to prometheus.yml :
# prometheus.yml
global:
    scrape_interval: 5s
    external_labels:
        monitor: 'my-monitor'
scrape_configs:
    - job_name: 'prometheus'
      target_groups:
          - targets: ['localhost:9090']
    - job_name: 'node-exporter'
      target_groups:
          - targets: ['node-exporter:9100']
Note that we reference the node-exporter by its service name which we specified in docker-compose.yml (the service label). Docker Compose makes the service available by that name for inter-container connectivity.
Grafana
At this point we’ve set up a Prometheus server in a basic configuration with two probes exporting metrics. If you’ve had a look around the Prometheus web front-end you’ve probably noticed that there’s a rudimentary interface in place to look at metrics.

This helps to get an overview or take a quick look but Grafana offers a much more powerful picture, as the very first screenshot in this blog post shows.
Adding Grafana to our set-up is again a simple extension to docker-compose.yml. Append the following lines:
grafana:
        image: grafana/grafana:3.0.0-beta7
        environment:
            - GF_SECURITY_ADMIN_PASSWORD=pass
        depends_on:
            - prometheus
        ports:
            - "3000:3000"
The complete final version version of all config files can be found in this github repo.
After restarting the service with
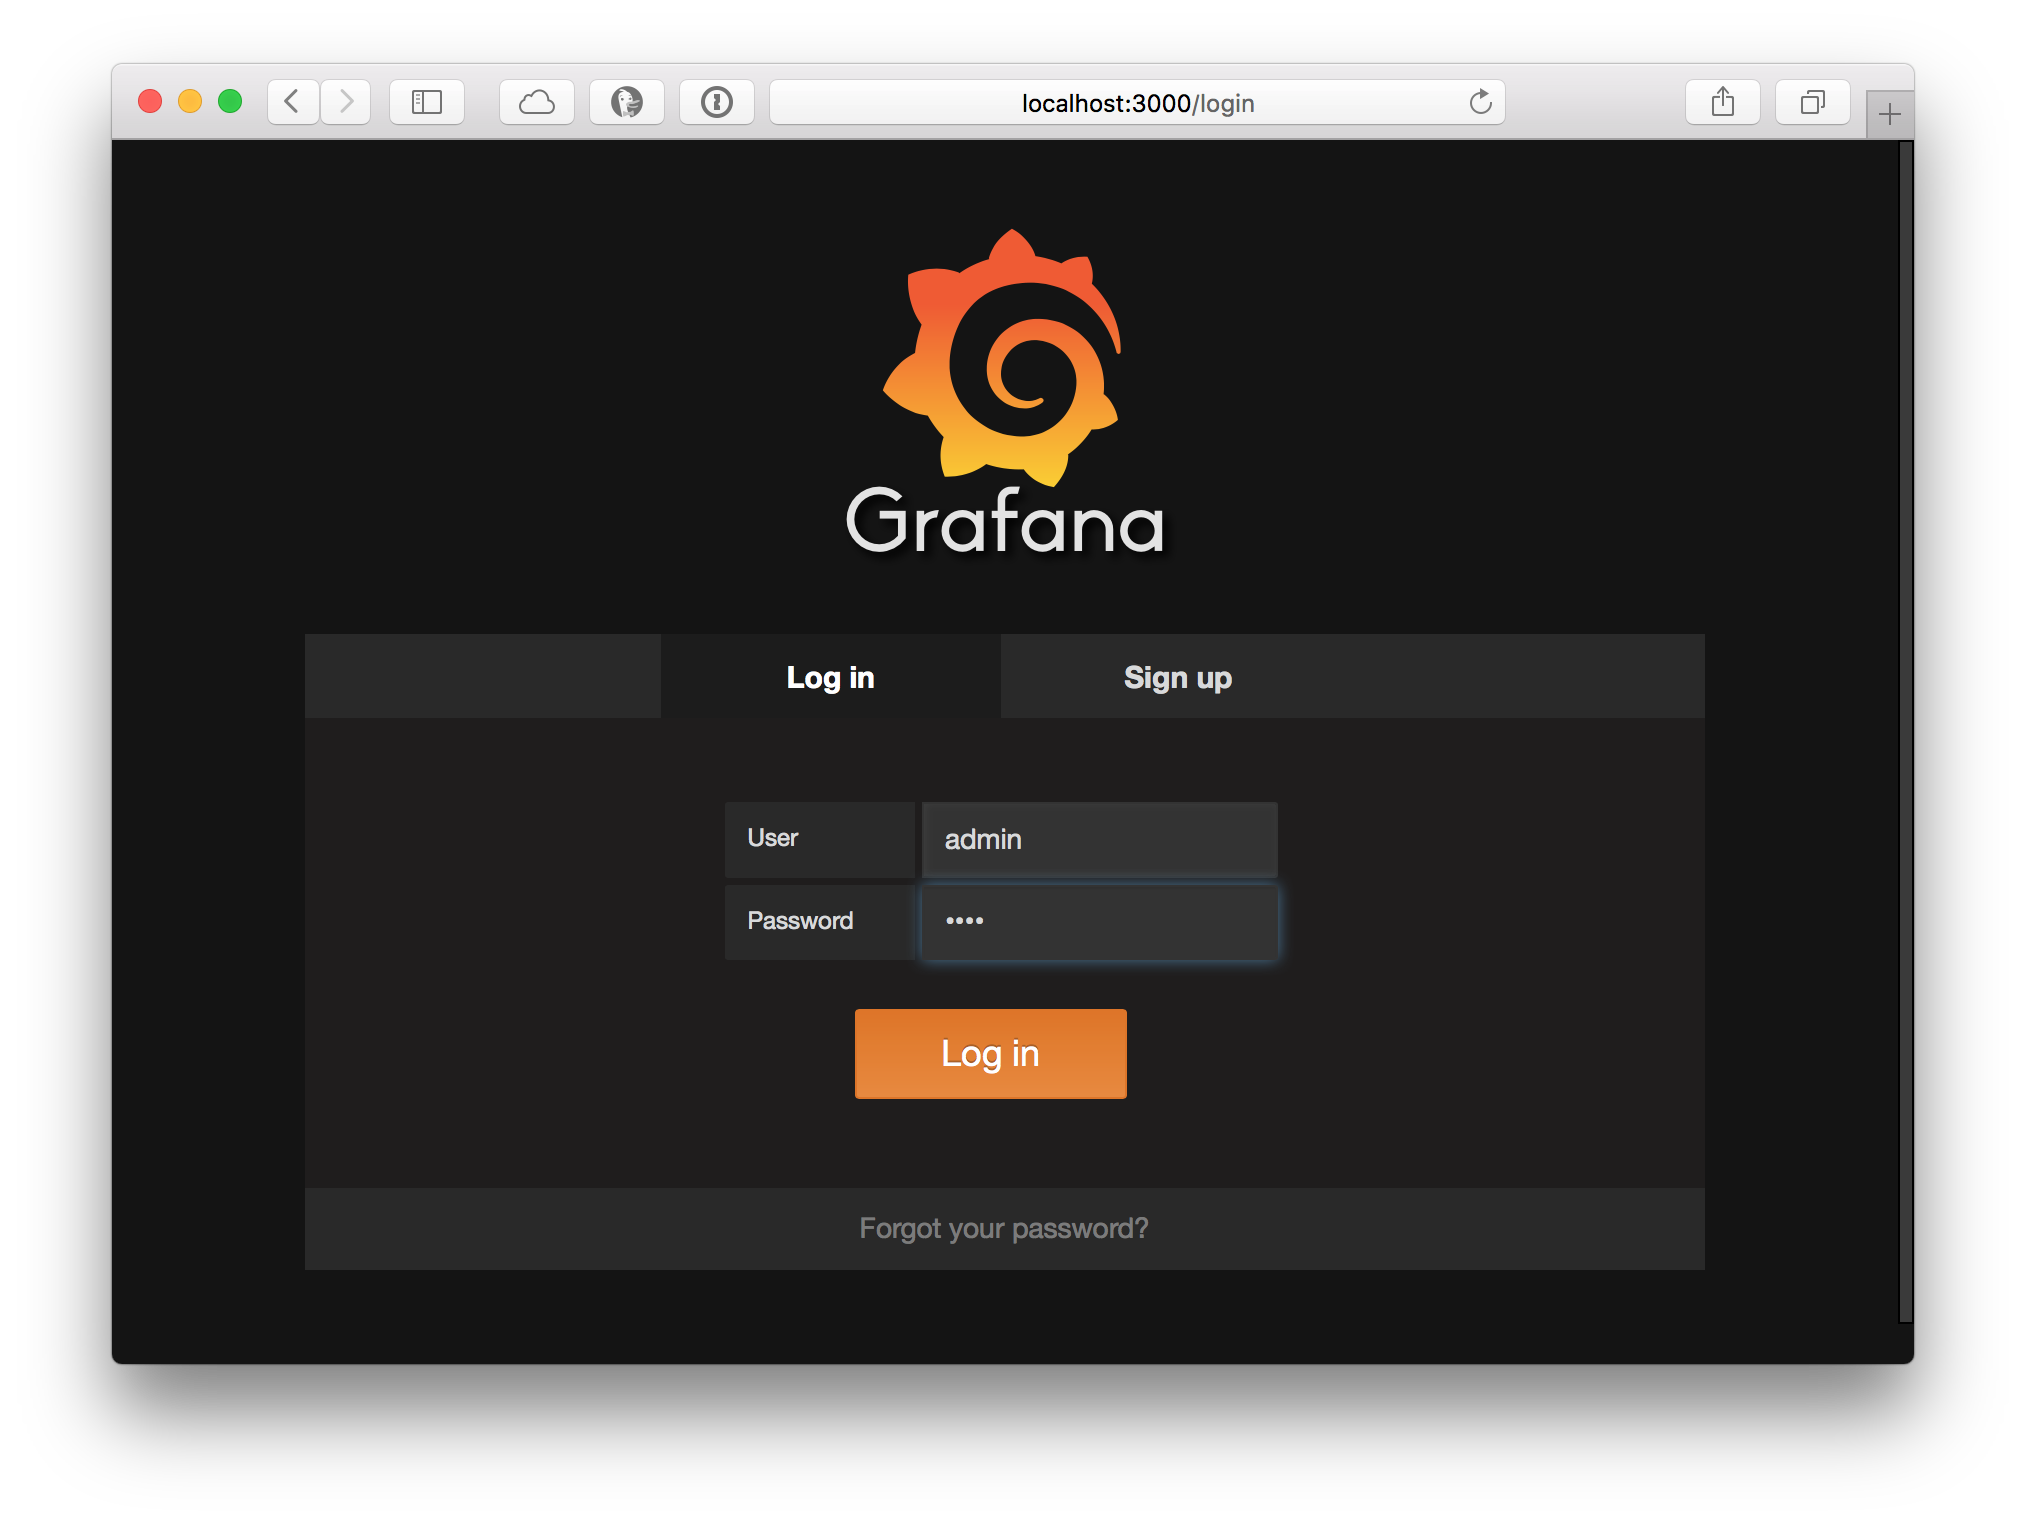
docker-compose upyou can access Grafana at http://localhost:3000/login
Persistence
Up to this point we’ve simply set things up via configuration files to bring up the service and while we did record some metrics within the running containers we’ve not made any changes that we would necessarily want to keep around between restarts of the system.
Obviously this is fine for testing but before we go on to configure dashboards, we’ll want to make sure everything is actually persisted in docker volumes.
To do so, we append the following lines to our docker-compose.yml configuration file:
volumes:
        prometheus_data: {}
        grafana_data: {}
This defines two data volumes, one for Prometheus and one for Grafana. To use them, add the following lines to their service definition (adding a new volumes: section to grafana‘s service definition):
services:
        prometheus:
            ...
            volumes:
                - prometheus_data:/prometheus
                ...
        grafana:
            ...
            volumes:
                - grafana_data:/var/lib/grafana
This tells docker-compose to map the docker volumes we’ve defined into the containers where their data directories are located. The docker volumes will be created if they don’t exist and will persist even after the containers are stopped and removed.
Now because we’ve been running the service before we need to remove the containers before we bring it back up again. (Otherwise you will get a WARNING: Service "prometheus" is using volume "/prometheus" from the previous container, going on to inform you that the volume will not be used.)
So we run
docker-compose rmfollowed by
docker-compose upand everything should be the same as before, except now we save all changes (and recorded metrics) to the specified docker volumes.
Configuring Grafana
As you’ve probably noticed, we’ve specified the admin user’s password in docker-compose.yml as pass. Use these credentials to log in and navigate to http://localhost:3000/datasources to set up our Prometheus server as the data source for Grafana. Give it a name, make sure you select “Prometheus” as the type, and set the URI to http://prometheus:9090.

Note again that we can use the service name as the host name for the URI to connect Grafana to Prometheus.
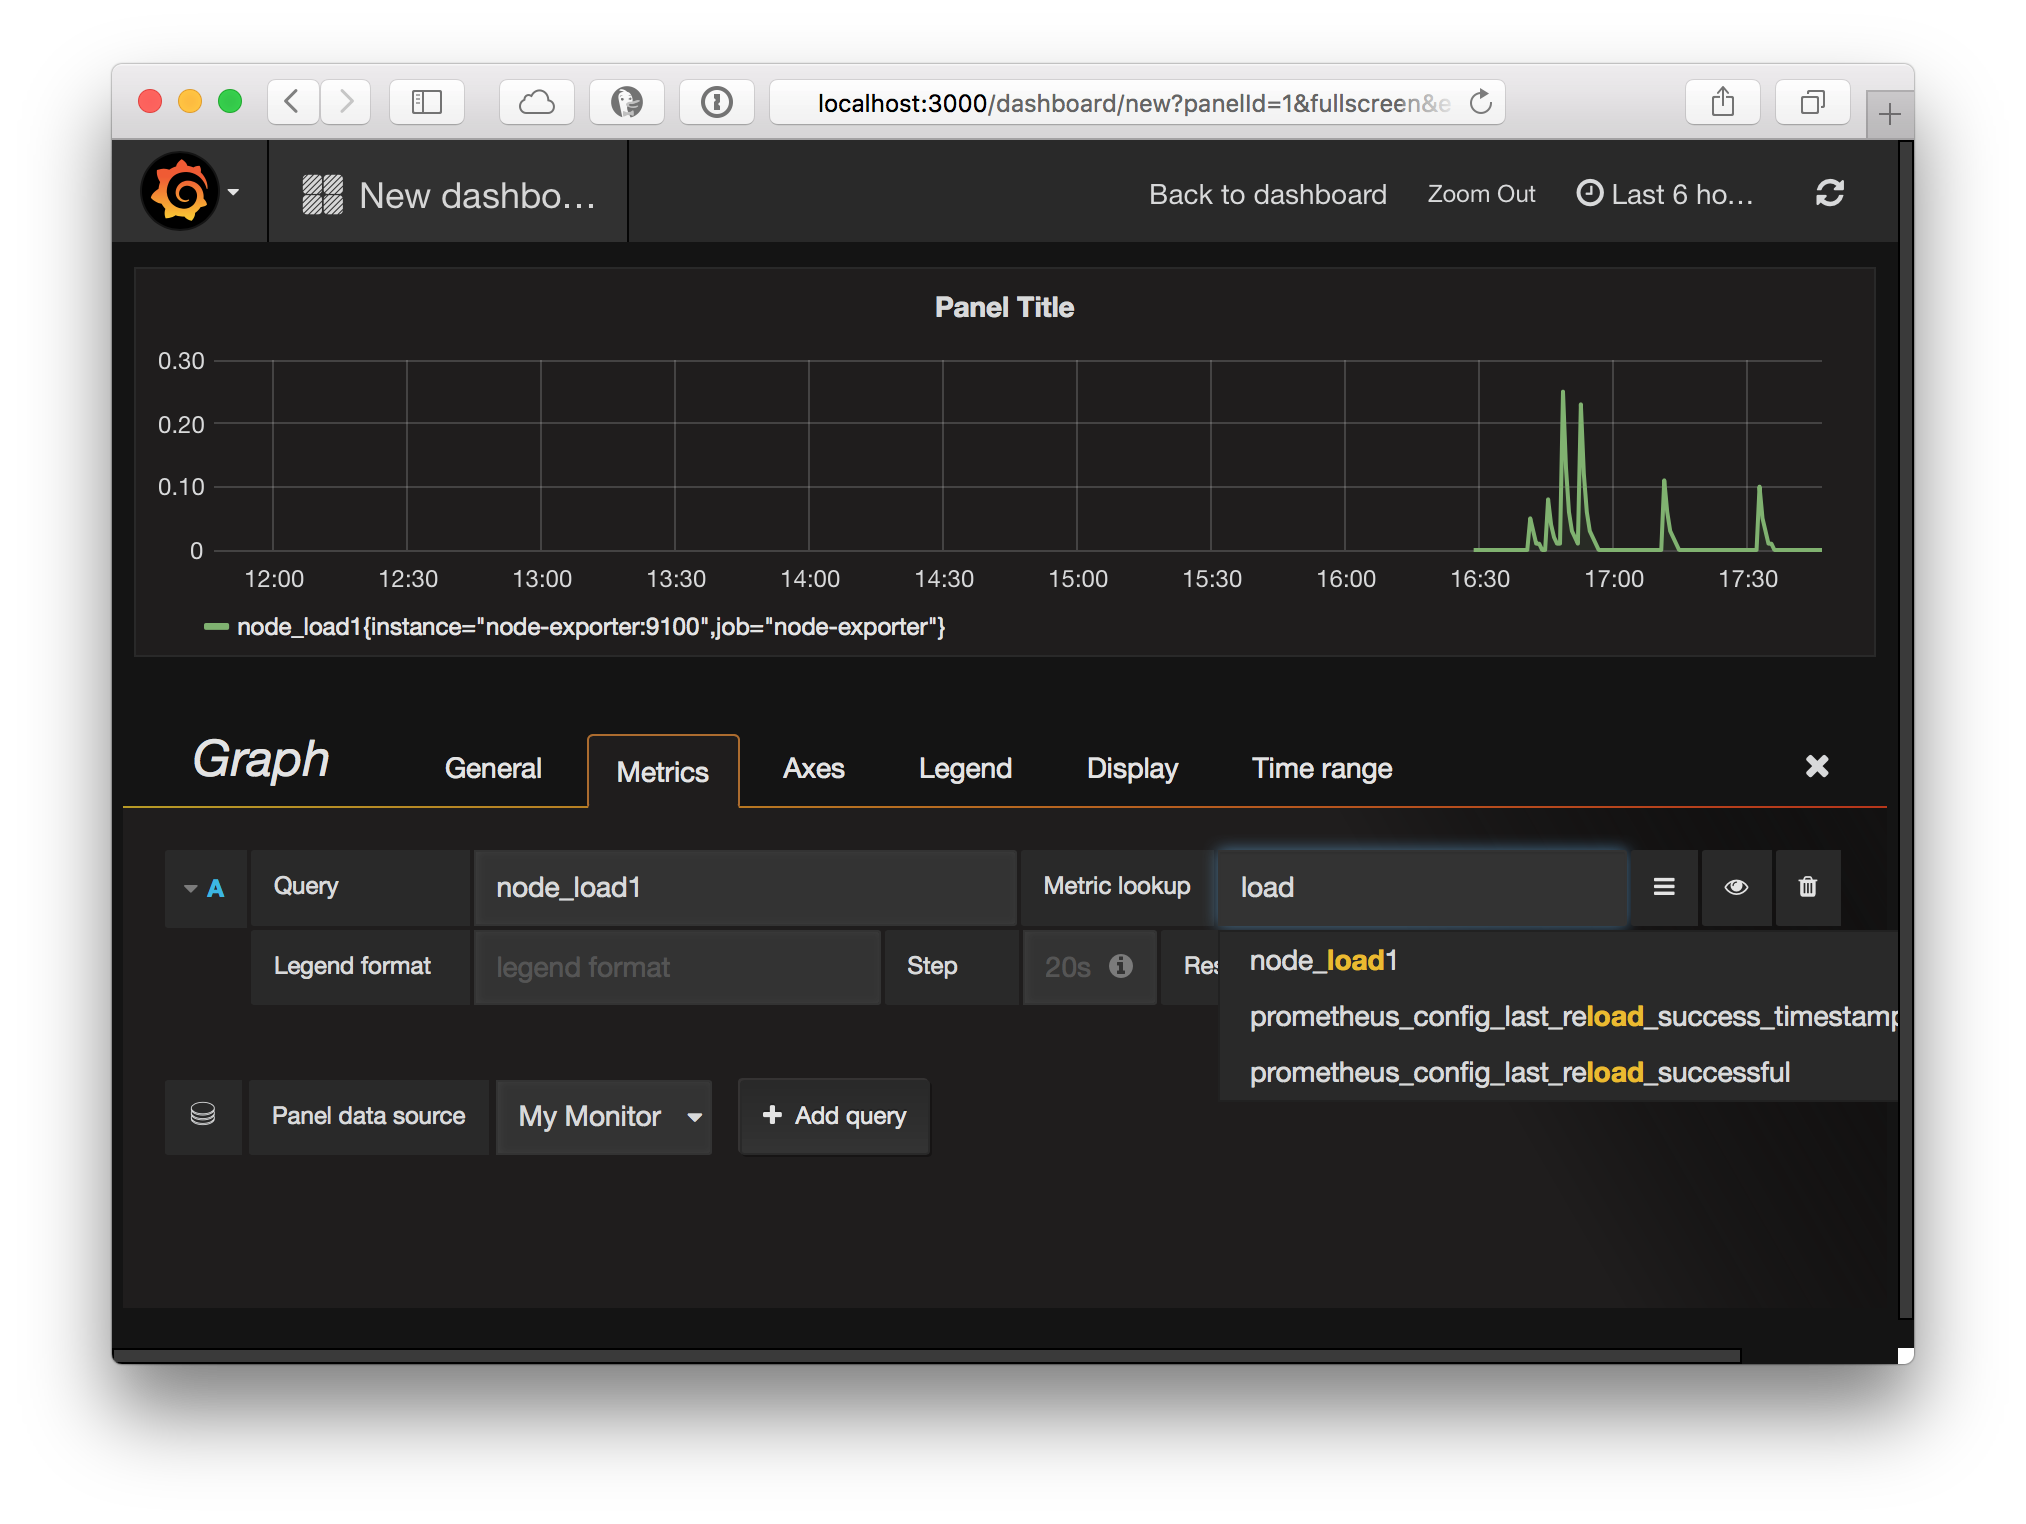
Next head over to http://localhost:3000/dashboard/new to create a new dashboard and add a graph:

Make sure to select “My Monitor” as the panel data source and after doing so you can use the metric lookup field to filter for any of the metrics available in Prometheus.
Grafana offers a lot of options to create great looking graphs and all of this is extensively documented at http://docs.grafana.org.
Limitations
The current set-up has a few limitations which make it unsuitable to be run as-is except for testing and learning purposes:
- The Prometheus web front-end is exposed on port 9090 and freely accessible without authentication.
- Grafana supports authentication but is not configured for SSL.
In addition, while we display metrics in graphs we have not yet set up any automatic alerts that trigger when certain conditions are met. And these alerts should be delivered as notifications in various way, for example via email or a slack message.
Please see part 2 of this mini-series where these limitations are being addressed.
If you have any questions or comments, please get in touch!